
“Set up proper monitoring” sat on my homelab backlog longer than I’d like to admit. What finally made me want to work it was another project I actually want to build, which turned out to need real observability underneath it first. So I went looking into how to do that properly on Proxmox, and found that upgrading from 8 to 9 had already handed me the best part of it. As of VE 9, the pvestatd daemon pushes its own metrics straight out to any OpenTelemetry Protocol (OTLP) endpoint, every few seconds, without anything installed on the nodes to make it happen.
So that covers performance: how the nodes, guests, and storage are doing right now. It does not tell you which guests have no backup job, whether replication is healthy, or what state the cluster thinks a VM is in, because that data lives in the Proxmox API rather than in system stats. And it stays silent when corosync loses quorum or a Ceph OSD starts flapping, because those are log events and OTLP metrics are not logs.
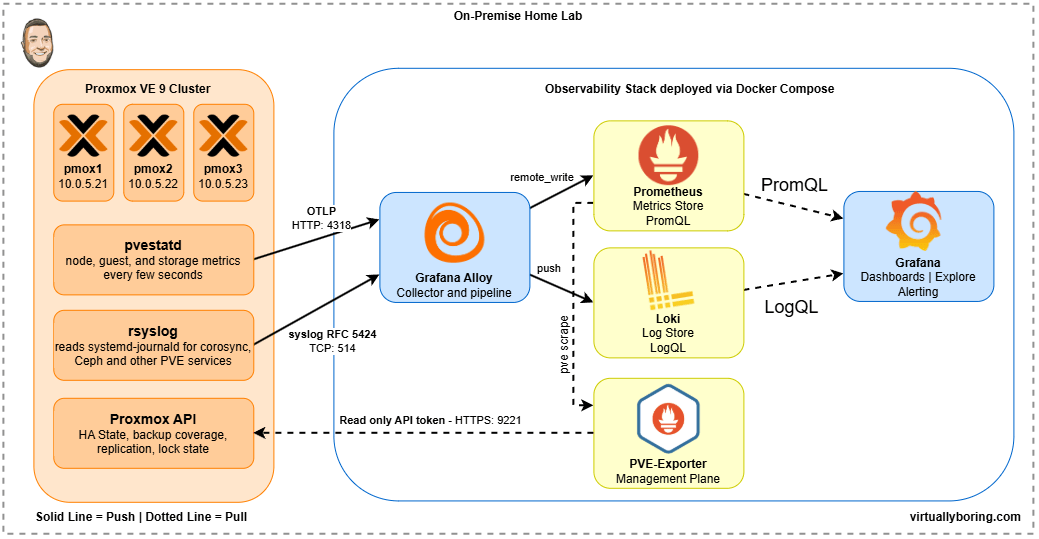
Proxmox observability needs three data streams, and no single product covers all three. Performance metrics arrive on Proxmox’s native OTLP push. The management plane, meaning HA state, backup coverage, and replication health, has to be read out of the Proxmox API by pve-exporter. Logs leave each node through rsyslog and land in Alloy. That’s why this post has three parts. Everything ends up in a self-hosted Grafana stack.
My Observability Stack
First I had to decide on an observability stack. There are a ton of options ranged from cloud-hosted SaaS (Datadog, Grafana Cloud, New Relic) to fully self-hosted. I wanted to go fully self-hosted which made me immediately think of running the entire Grafana observability, so that is what I did!
Here is what I deployed using Docker Compose:
- Grafana is the visualization and dashboarding layer: dashboards, Explore, and alerting. Grafana itself stores nothing. It reads from Prometheus and Loki.
- Prometheus is the metrics backend. It stores time-series metric data, provides a query language (PromQL) for it, and receives metrics via remote_write from Alloy.
- Loki is the log aggregation backend. It stores logs indexed by labels (like
host="pmox1"orjob="syslog") and makes them queryable with LogQL. Loki is intentionally lightweight: it indexes labels, not full log content. - Grafana Alloy is the collection and pipeline layer. Alloy runs on TrueNAS as a container and acts as the central hub: it receives syslog from Proxmox nodes, receives OTLP metrics from Proxmox, scrapes exporters, and forwards everything to the right backend. Think of it as the plumbing between your infrastructure and your storage.
All of this runs on-prem. No data leaves the homelab, no subscription required, and the entire stack is open source.
What is OpenTelemetry?
I’ve mentioned OTLP a few times above, so what is it? OpenTelemetry (OTel) is a vendor-neutral, open-source framework for collecting and exporting telemetry data: metrics, logs, and traces. Instead of locking your observability data into a proprietary agent or format, OTel defines a standard protocol that any compatible backend can receive.
OTLP (OpenTelemetry Protocol) is the wire format: a binary protocol that runs over HTTP or gRPC. It’s supported by Grafana Alloy, Loki, Prometheus, and, as of Proxmox VE 9, the Proxmox hypervisor itself.
Why does this matter? Because Proxmox 9 can now push its own metrics directly to any OTLP-compatible collector. No scraping, no polling, no sidecar exporter on each node for basic metrics. It just pushes.
A note on traces
If you know OTel, you know the “three pillars” are metrics, logs, and traces. There are no traces in this post, and that isn’t an oversight.
Traces require instrumented code. Something has to create a span when a request arrives, propagate the trace context to whatever it calls next, and emit the result. That means an SDK compiled into the application. Proxmox is a closed appliance. pvedaemon, pvestatd, and pveproxy aren’t instrumented and emit no spans, so there is no setting that turns traces on. There’s nothing generating them.
Traces enter a homelab one layer up: in an application you wrote, running on a VM or container, exported to a trace backend like Grafana Tempo. Worth doing, but that monitors your app, not your hypervisor. For the hypervisor itself, complete coverage means the three lanes below.
The Three Swim Lanes of Proxmox Observability
So what is the difference between monitoring and observability? Monitoring answers questions you already knew to ask: is the node up, is the disk filling, is CPU over 80%. You define the question up front and get back a yes or no. Observability is having enough signal on hand to answer the questions you didn’t think to ask in advance, like why a VM stalled at 2am while every dashboard stayed green. Monitoring tells you something broke. Observability is how you work out why. Getting there on Proxmox means three distinct data streams, and each one needs its own collection method.
| What You’re Monitoring | Proxmox OTLP | pve-exporter | rsyslog → Alloy |
|---|---|---|---|
| Node CPU, memory, disk, network | ✅ | ✅ | ❌ |
| Per-VM / LXC resource usage | ✅ | ✅ | ❌ |
| Storage pool usage | ✅ | ✅ | ❌ |
| Per-guest pressure (PSI) | ✅ | ❌ | ❌ |
| Per-device guest block stats | ✅ | ❌ | ❌ |
| VM HA state | ❌ | ✅ | ❌ |
| Backup job coverage | ❌ | ✅ | ❌ |
| Replication status | ❌ | ✅ | ❌ |
| Host system logs | ❌ | ❌ | ✅ |
| Corosync / cluster events | ❌ | ❌ | ✅ |
| Ceph daemon logs | ❌ | ❌ | ✅ |
| Proxmox service logs | ❌ | ❌ | ✅ |
Proxmox OTLP is the native metric push built into the Proxmox hypervisor. The pvestatd daemon (Proxmox VE Administration Guide §18.3) collects resource data from the cluster every few seconds and pushes it outbound to any OTLP endpoint you configure. This covers the performance layer: how are my nodes, VMs, and storage performing right now?
prometheus-pve-exporter is a lightweight container that authenticates to the Proxmox API and exports the management layer, the things the OS can’t see: HA state per VM, which guests have no backup job, replication health, subscription status. This data lives in the Proxmox API, not in system stats. No amount of OTLP or node metrics gives you this.
rsyslog → Alloy syslog covers logs. Note: this is different from installing the Alloy agent on each Proxmox node. In this setup, rsyslog runs on each Proxmox node, reads from systemd-journald, and forwards logs over the network via syslog protocol to the centralized Alloy instance already running on TrueNAS, which has a loki.source.syslog receiver on port 514. No Alloy binary on the Proxmox nodes. The logs it captures include corosync (cluster membership and quorum events), pve-cluster, pvedaemon, pveproxy, and all Ceph daemons (ceph-osd, ceph-mon, ceph-mgr), because they all run as systemd services and write to journald.
My Environment
Everything below is written for Proxmox VE 9. Currently I am at version 9.2.10, which is Debian 13 (Trixie) underneath. Proxmox 8 does not have the native OpenTelemetry metric server at all, and the logging setup differs enough that I have deliberately kept it out of this post. If you are still on 8, upgrade first.
I have three Proxmox nodes: pmox1 (10.0.5.21), pmox2 (10.0.5.22), pmox3 (10.0.5.23) in a cluster. I have Grafana, Loki, and Prometheus running on TrueNAS as containers, with Grafana Alloy as the central collector all deployed via Docker Compose using Portainer. Alloy already has OTLP receivers on port 4317 (gRPC) and 4318 (HTTP), and a syslog listener on port 514. If you don’t have Alloy running yet, build that first: my config is in the repo linked above, and Parts 1 and 3 both assume those three listeners already exist.
Part 1: Proxmox Native OTLP Metrics
Proxmox 9 adds OpenTelemetry as a supported metric server type alongside Graphite and InfluxDB. It’s configured once at the datacenter level and applies to all nodes in the cluster. You don’t touch each node individually.
Note: OpenTelemetry is now listed on the official External Metric Server wiki page, but it is only a bullet point. Graphite and InfluxDB each get a full configuration section, and OpenTelemetry gets none. So while the feature is officially acknowledged, there is still no official walkthrough. The implementation details in this post come from the Proxmox development mailing list, the community forums, and my own cluster.
What pvestatd collects
The pvestatd daemon (Proxmox VE Administration Guide §18.3) collects and pushes the following via OTLP:
- Per node: uptime, CPU usage and load averages, memory (total/used/free/available/shared/ZFS ARC size), swap, filesystem stats, network in/out.
- Per VM and LXC container: CPU usage, CPU count, memory allocation and actual usage, disk allocation and usage, network in/out, disk read/write, uptime. QEMU guests also emit per-device block statistics (
proxmox_vm_blockstat_scsi0_*,ide2_*) and, where the guest agent supports it, balloon info. Proxmox VE 9 adds pressure (PSI) metrics per guest:proxmox_vm_pressurecpusome_*,pressurecpufull_*,pressureiosome_*,pressureiofull_*,pressurememorysome_*,pressurememoryfull_*. - Per storage pool: total capacity, used, available, plus
active,enabledandsharedflags.
Pressure metrics are guest-only. Proxmox VE 9 release notes talk about system pressure stats, and it is easy to assume those flow through OTLP at the node level too. They do not, at least not in 9.x as I am running it. I have
proxmox_vm_pressure*for every guest, butproxmox_node_pressure*does not exist. If you want node-level PSI, you will need node_exporter on each host, which exposesnode_pressure_cpu_waiting_seconds_totaland friends from/proc/pressure.
Configure via the UI
- Log into the Proxmox web UI
- Navigate to Datacenter → Metric Server
- Click Add and select OpenTelemetry
- Fill in the details:
- Name:
alloy-otlp - Server:
10.0.5.10 - Port:
4318 - Protocol:
HTTP - Path:
/v1/metrics - Verify SSL: disabled (unless you have TLS on your Alloy endpoint)
- Name:
- Click Create
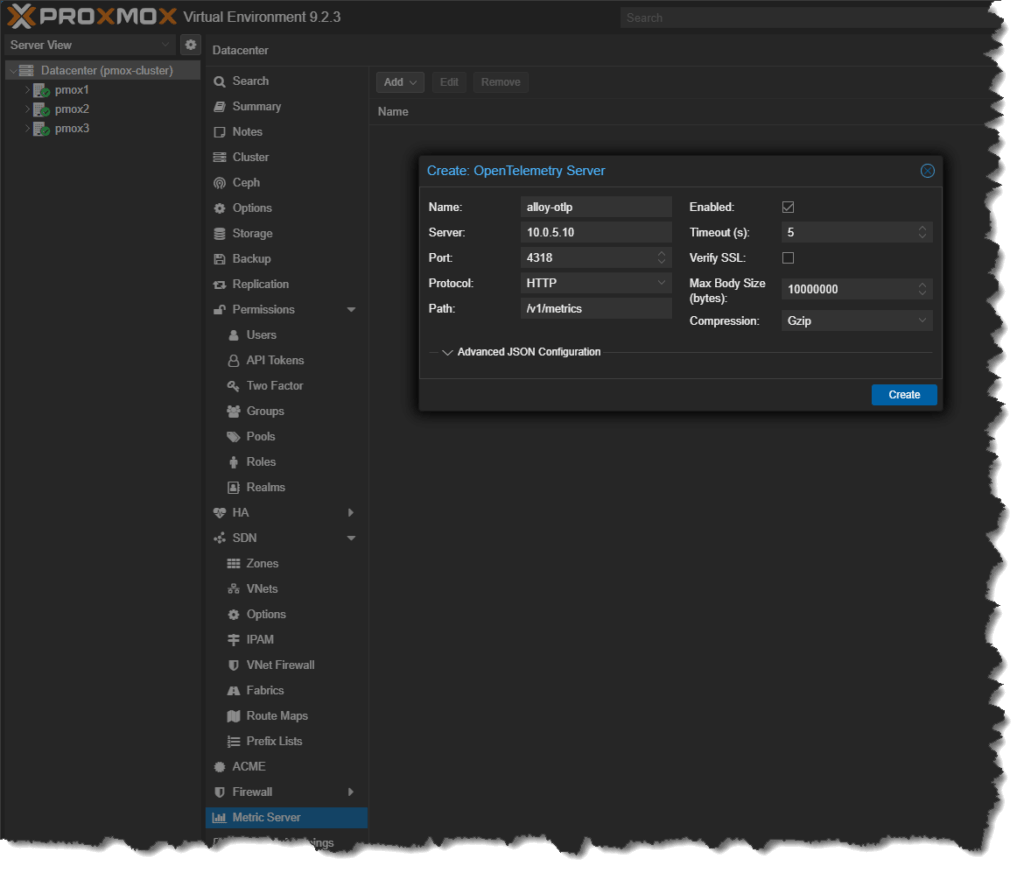
No SSH, no config files, no per-node changes. Proxmox starts pushing metrics immediately across the whole cluster.
Verify
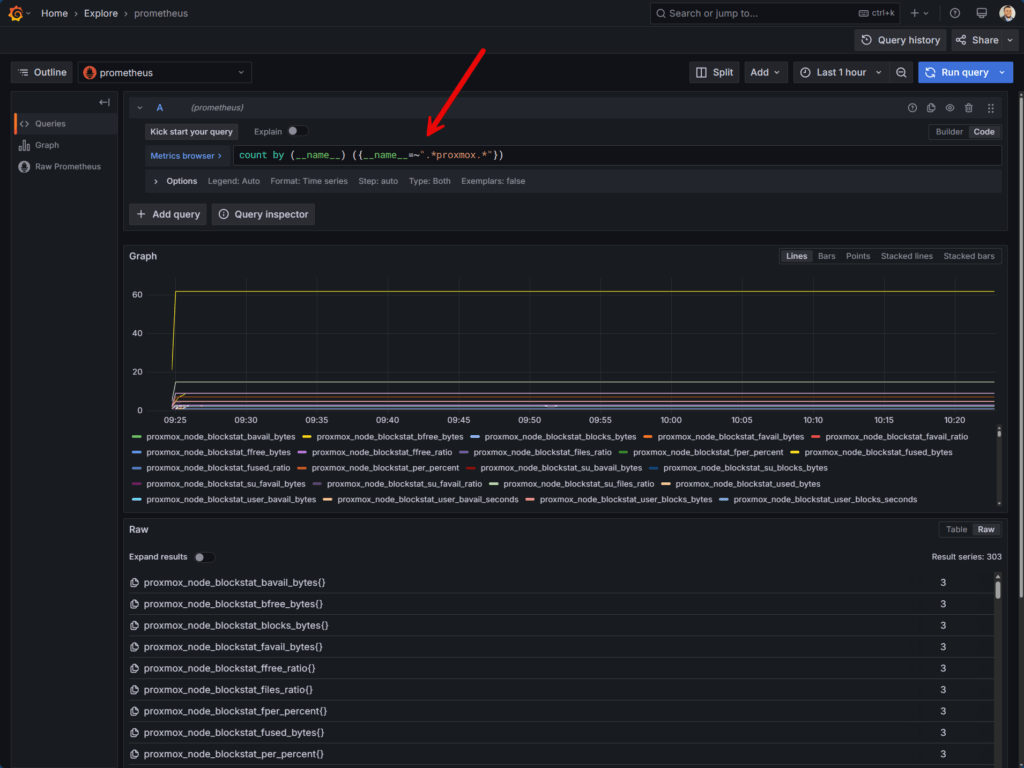
In Grafana Explore, query Prometheus. Metrics arriving via OTLP follow OpenTelemetry naming conventions rather than the pve_* prefix from pve-exporter. Start with a grouped metric-name check so the result is readable:
count by (__name__) ({__name__=~".*proxmox.*"})Code language: JavaScript (javascript)You should see proxmox_node_*, proxmox_vm_*, and proxmox_storage_* metrics.
Then confirm every node is actually reporting, not just one noisy one:
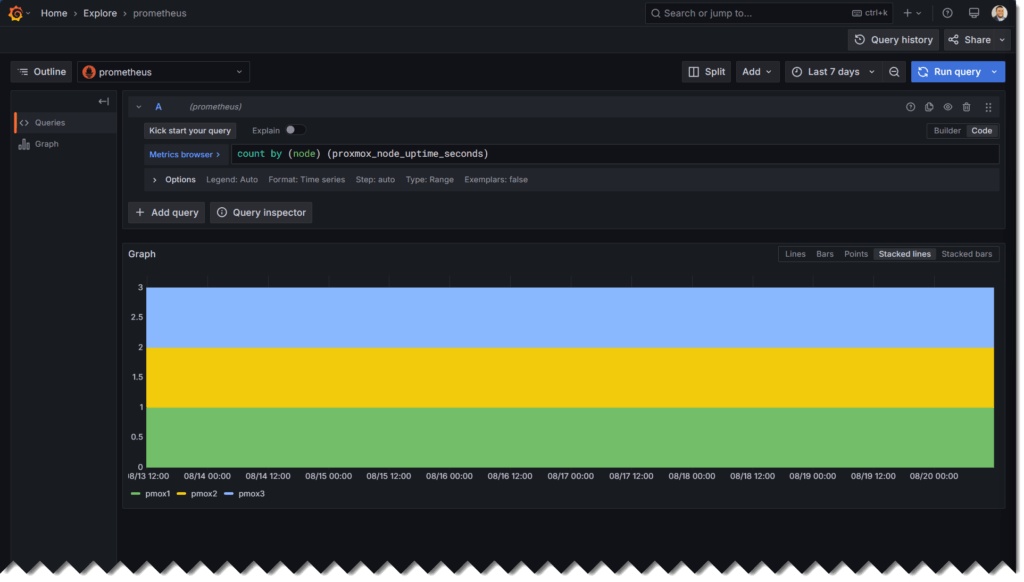
count by (node) (proxmox_node_uptime_seconds)You should get one series per node in your cluster. In mine that is pmox1, pmox2 and pmox3. If a node is missing here, it is missing everywhere. Check that pvestatd is running on it before you go any further.
A word on metric names and units
This is the part that cost me the most time, so I want to save you the trouble. Proxmox’s OTLP exporter infers a unit suffix from the metric name, and it gets it wrong often enough that you cannot trust the suffix. Build a dashboard assuming the names are honest and your panels will be off by a factor of 100, or wrong in a way that is much harder to spot.
Here are real values pulled straight from my cluster:
| Metric | Actual value | What it really means |
|---|---|---|
proxmox_node_cpustat_cpu_percent |
0.006 | A ratio between 0 and 1, not a percent. Multiply by 100. |
proxmox_vm_cpu_percent |
0.0116 | Also a ratio. That guest is using 1.16% of its CPU. |
proxmox_node_cpustat_cpus_ratio |
20 | The number of CPU cores. Not a ratio at all. |
proxmox_node_cpustat_cpus_percent |
20 | The same core count, exported a second time under a different name. |
proxmox_node_cpustat_total_bytes |
320335823 | CPU time. There are no bytes involved. |
proxmox_node_memory_used_bytes |
varies | Genuinely bytes. Memory metrics are correct. |
proxmox_storage_used_bytes |
varies | Genuinely bytes. Storage, network and disk metrics are correct too. |
The pattern is simple enough to remember: byte-valued metrics are trustworthy, CPU-valued metrics are not. Anything with cpustat in the name deserves a sanity check in Grafana Explore before it goes anywhere near a dashboard. And when a CPU metric ends in _percent, assume it is a 0 to 1 ratio and set the Grafana panel unit to Percent (0.0-1.0) rather than multiplying by 100 in the query.
Labels you get for free
One genuinely nice thing about the OTLP feed: guest metrics arrive already labelled with everything you need to make them readable. A single series comes back looking like this. It is sample output, not something you type:
proxmox_vm_cpu_percent{
  job="proxmox-ve",
  name="AD1",
  node="pmox1",
  type="qemu",
  vmid="104"
}Code language: JavaScript (javascript)
You get the guest name, the node it is running on, whether it is qemu or lxc, and the vmid. That means no join against a separate info metric just to turn 104 into AD1 on a dashboard, something you do have to do with plenty of other exporters. Grouping by type to compare VM versus container behaviour is a one-line change.
Part 2: pve-exporter (Management Plane Metrics)
The OTLP push covers resource performance. pve-exporter covers operational state, the things the hypervisor knows that system stats don’t. It authenticates to the Proxmox API using a read-only service token and exposes metrics Prometheus can scrape.
Key metrics it provides:
pve_up{id="qemu/100"}: running state per VM and LXCpve_not_backed_up_info: guests with no backup job coveragepve_ha_state: HA service state per VM (started, migrate, fence, error)pve_lock_state: whether a guest is currently locked by a backup, migration or snapshotpve_guest_info: VM name, node, type, and tags (useful for label-based alerting)pve_node_info: per-node online state and cluster membershippve_disk_usage_bytes/pve_disk_size_bytes: storage pool capacity from the API’s point of viewpve_version_info: the exact PVE version each node is running, which makes upgrade drift obviouspve_subscription_info: subscription level and expiry date per nodepve_replication_*: replication job health, last sync, failure count
One caveat on pve_replication_*: the exporter only emits these when you actually have replication jobs configured. My cluster uses Ceph for shared storage rather than ZFS replication, so these series simply do not exist for me. If you go looking for them and come up empty, that is probably why. The exporter is not broken.
Create a read-only API token
Create a dedicated read-only service account in Proxmox for the exporter. Full details in the Proxmox User Management documentation.
- Datacenter → Permissions → Users → Add user
pveexporter@pve - Datacenter → Permissions → API Tokens → Add a token for
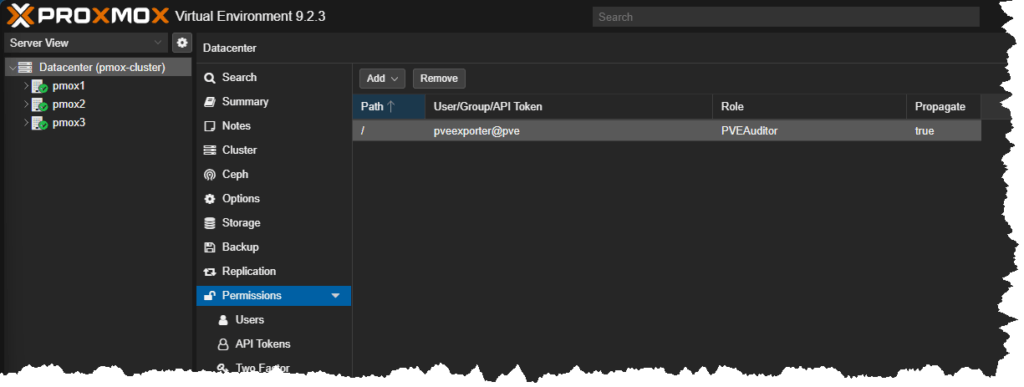
pveexporter@pve, uncheck “Privilege Separation” - Datacenter → Permissions → Add permission: path
/, userpveexporter@pvePVEAuditor
Save the token secret. It’s shown once.
Deploy the container
In my home lab, I use Portainer to manage my Docker Hosts, and GitHub as my Git Repo. My docker compose stack for this container is: HomeLab/prometheus-proxmox-exporter.
The folder contains the production compose.yaml and a matching .env.example. The compose file runs prompve/prometheus-pve-exporter, publishes port 9221, joins the existing monitoring Docker network, and keeps the Proxmox credentials in environment variables instead of hard-coding them. Set the values from the Proxmox user and API token you created above:
PVE_USER=pveexporter@pve
PVE_TOKEN_NAME=your-token-id
PVE_TOKEN_VALUE=your-token-secret
PVE_VERIFY_SSL=trueCode language: JavaScript (javascript)
If your Proxmox nodes use self-signed certificates and the exporter host does not trust your Proxmox CA, set PVE_VERIFY_SSL=false. Otherwise, keep verification enabled.
docker compose up -dThen verify the exporter is running:
docker logs prometheus-proxmox-exporter
curl "http://localhost:9221/pve?target=10.0.5.21"Code language: JavaScript (javascript)
Configure Prometheus (or Alloy’s prometheus.scrape) to scrape each node’s metrics through the exporter:
scrape_configs:
  - job_name: 'pve'
    static_configs:
      - targets:
          - 10.0.5.21
          - 10.0.5.22
          - 10.0.5.23
    metrics_path: /pve
    params:
      module: [default]
      cluster: ['1']
      node: ['1']
    relabel_configs:
      - source_labels: [__address__]
        target_label: __param_target
      - source_labels: [__param_target]
        target_label: instance
      - target_label: __address__
        replacement: prometheus-proxmox-exporter:9221Code language: PHP (php)
The cluster=1 parameter pulls cluster-wide metrics. The node=1 parameter includes node-specific metrics. Prometheus still lists all three Proxmox nodes as scrape targets, but the relabeling sends each request to the exporter container and passes the original node IP as the target query parameter.
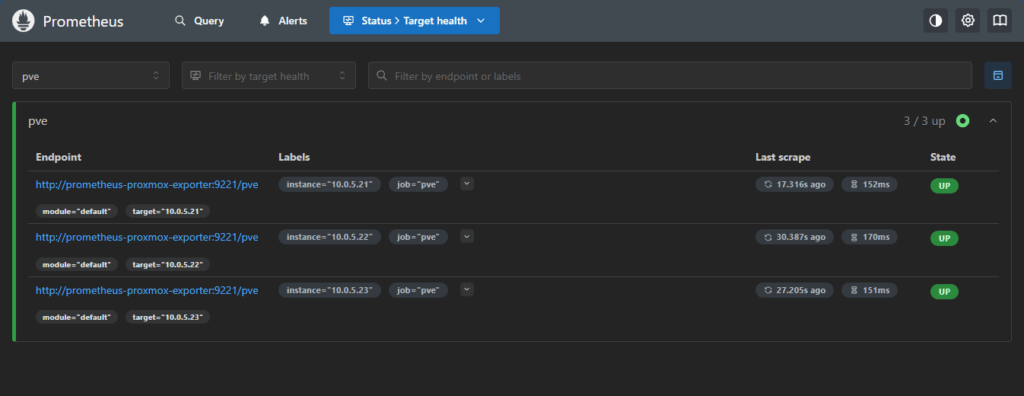
Once everything is deployed, I checked the Targets in Prometheus and saw they were in there and showing green!
Part 3: Logs (rsyslog → Alloy → Loki)
The OTLP setup and pve-exporter handle metrics. Logs need a separate pipeline.
Every service on a Proxmox node logs to systemd-journald, including corosync (cluster membership and quorum), pve-cluster, pvedaemon, pveproxy, and the Ceph daemons (ceph-osd, ceph-mon, ceph-mgr). Getting those into Loki means reading from journald and forwarding them over the network.
The approach here uses rsyslog as a forwarder, not an Alloy agent on each Proxmox node. rsyslog installs on each Proxmox node, reads from journald, and sends logs to the syslog listener already running in TrueNAS Alloy on port 514. Alloy then ships them to Loki. The Proxmox nodes themselves stay light: no Alloy binary, no extra agent to manage.
Run the following steps on each Proxmox node (pmox1, pmox2, pmox3).
1. Install rsyslog
Proxmox 9 (Debian 13 Trixie) ships with only systemd-journald. rsyslog is not installed by default.
apt update
apt install -y rsyslog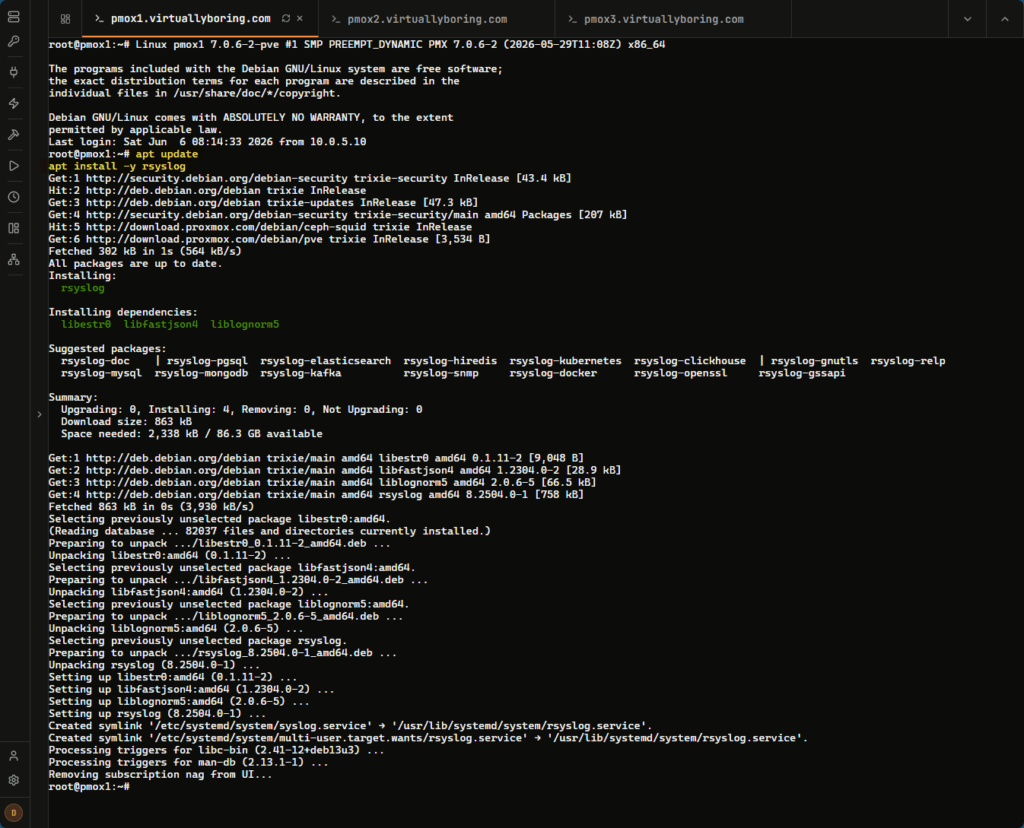
2. Configure rsyslog to read from journald directly
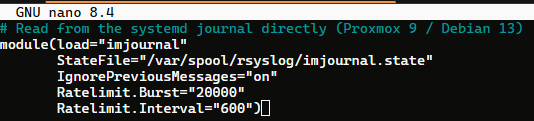
Proxmox 9 ships only systemd-journald, so rsyslog has to read the journal directly. That is exactly what the imjournal module does. It reads the systemd journal in its native binary format, with no intermediate socket and no race condition against journald.
First, create the state directory that imjournal uses to track its read position in the journal:
mkdir -p /var/spool/rsyslogCode language: JavaScript (javascript)Then create the drop-in config:
nano /etc/rsyslog.d/01-imjournal.conf# Read from the systemd journal directly (Proxmox 9 / Debian 13)
module(load="imjournal"
StateFile="/var/spool/rsyslog/imjournal.state"
IgnorePreviousMessages="on"
Ratelimit.Burst="20000"
Ratelimit.Interval="600")Code language: PHP (php)IgnorePreviousMessages="on" tells rsyslog to start from the current journal position and skip historical entries. This matters more than it looks: set it to "off" and rsyslog replays the entire journal history on first start. On a host with weeks of logs that queues hundreds of thousands of messages at once, spikes memory past 300 MB, and trips rate limiting that silently drops most of them. Leave it "on". The rate limit values give you headroom for normal bursts without throttling.
3. Add the rsyslog forwarding rule
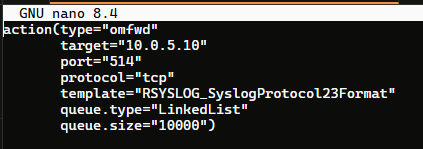
nano /etc/rsyslog.d/90-loki-forward.confaction(type="omfwd"
target="10.0.5.10"
port="514"
protocol="tcp"
template="RSYSLOG_SyslogProtocol23Format"
queue.type="LinkedList"
queue.size="10000")Code language: JavaScript (javascript)Two details matter here. RSYSLOG_SyslogProtocol23Format emits RFC 5424, which is what Grafana Alloy’s syslog receiver expects. Send it anything else and Alloy silently drops the messages while the TCP connection still looks perfectly healthy. And queue.type="LinkedList" adds an in-memory queue so a brief Alloy outage does not cost you logs.
4. Validate and restart
rsyslogd -N1Expected output (this is what rsyslog prints back at you, not a command to run):
rsyslogd: End of config validation run. Bye.Code language: HTTP (http)Then enable and start rsyslog:
systemctl enable --now rsyslog
systemctl restart rsyslog
5. Send a test log
logger -t proxmox-obs-test "observability stack test from $(hostname) $(date --iso-8601=seconds)"Code language: JavaScript (javascript)
6. Verify in Loki
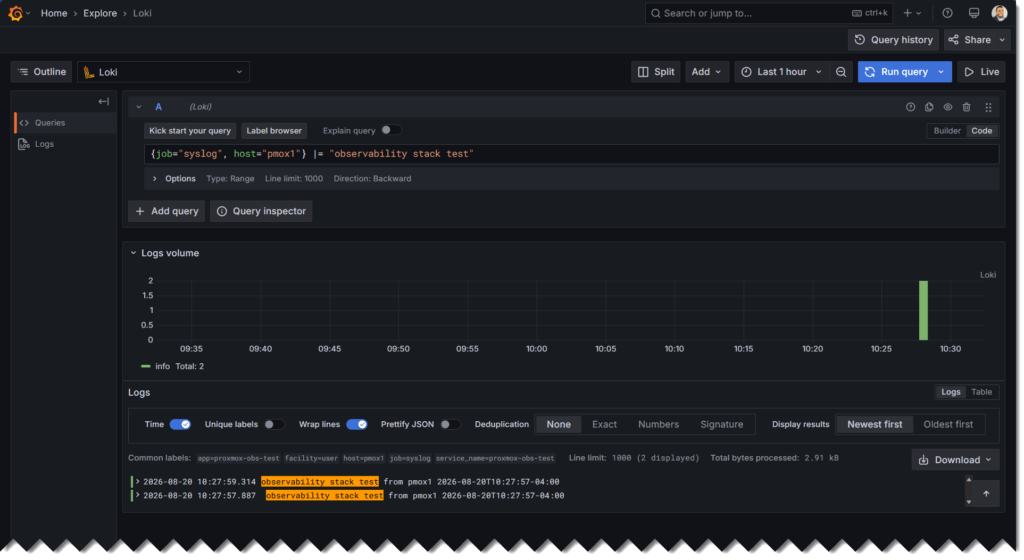
Loki has no web portal. You query it through Grafana Explore. In Grafana, click the compass icon (Explore) in the left sidebar, switch the data source dropdown at the top to Loki, then switch the query editor to Code mode (top right of the query box).
Run:
{job="syslog", host="pmox1"} |= "observability stack test"Code language: JavaScript (javascript)You should see your test log line appear within a few seconds. If nothing shows up, check that the time range is set to Last 15 minutes and try again.
Once confirmed, repeat steps 1 through 5 on pmox2 and pmox3. Then verify all three:
{job="syslog", host=~"pmox1|pmox2|pmox3"}Code language: JavaScript (javascript)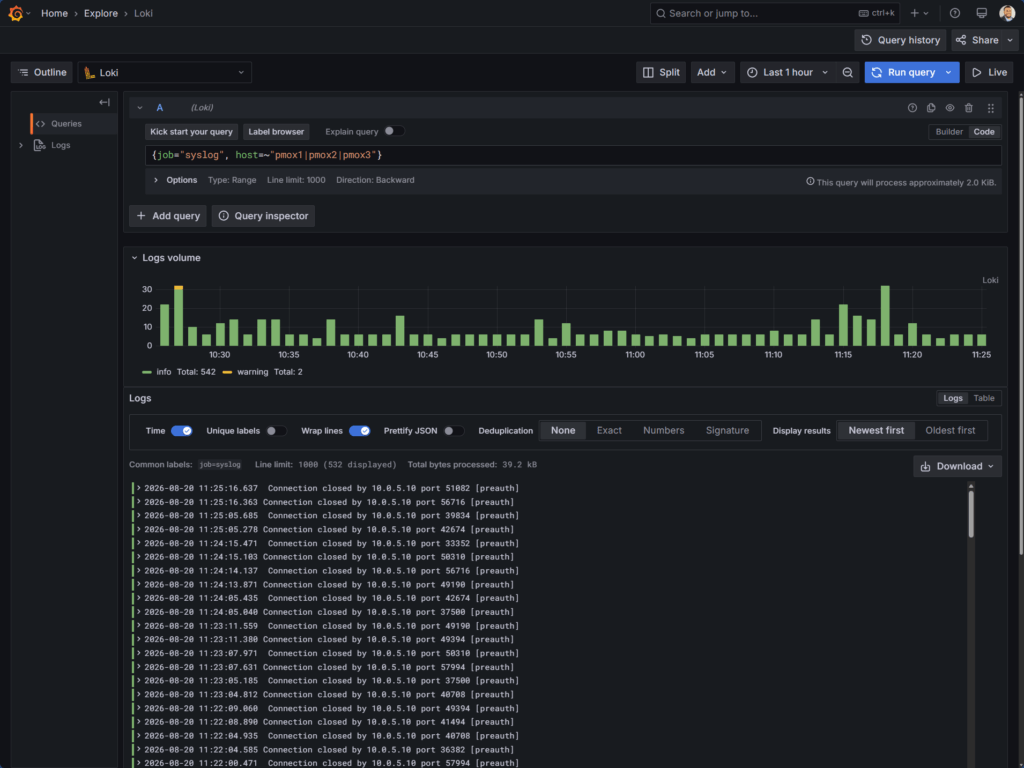
To specifically check for Ceph and cluster logs, filter on the app label rather than the log line. This is the important distinction: |= and |~ search the message body, but corosync and the Ceph daemons put their identity in the syslog tag, which Alloy maps to the app label. Searching the body for "corosync" returns nothing even though the logs are sitting right there:
{job="syslog", host=~"pmox.*", app=~".*corosync.*|ceph.*"}Code language: JavaScript (javascript)Loki anchors label regexes, so the leading .* is what lets this also match the (corosync) tag that systemd emits during service startup.
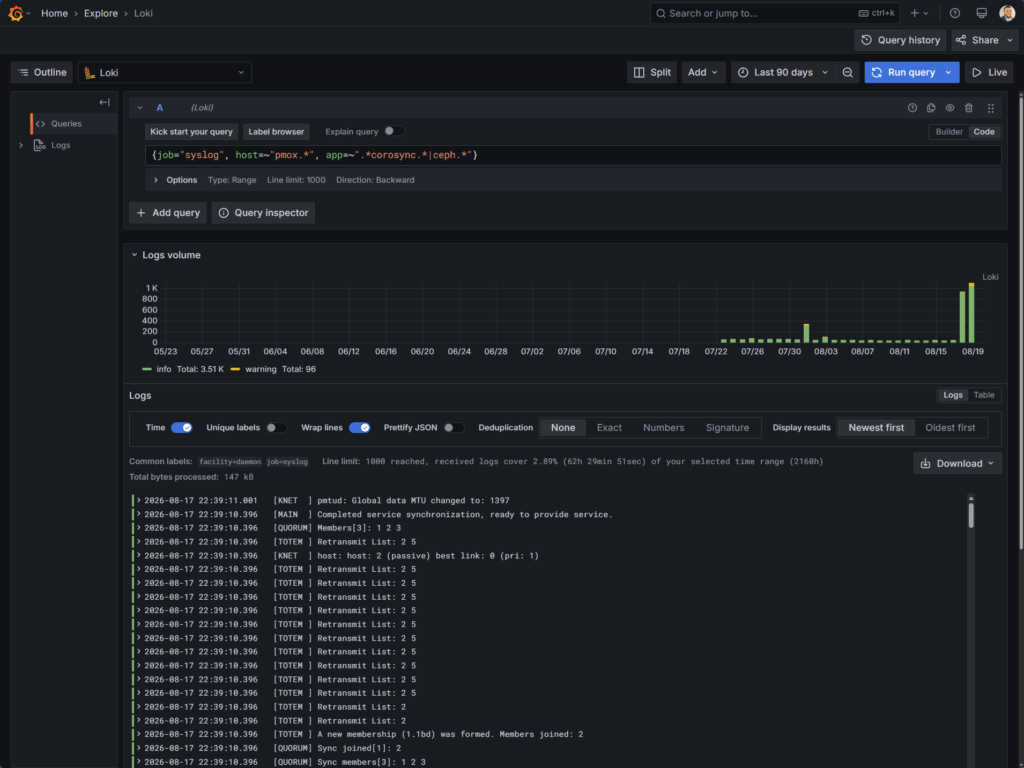
Do not be alarmed if that returns nothing over a short window. These daemons are quiet in steady state, and corosync only logs on membership and quorum changes. Widen the range to a few days and Grafana should return the quorum chatter. The block below is sample output, not a query. It is what you should see in the results panel, not something you paste into the query box:
# Sample output from Grafana: do not paste this into the query box
corosync  pmox3  [QUORUM] Members[3]: 1 2 3
corosync  pmox3  [MAIN  ] Completed service synchronization, ready to provide service.
corosync  pmox3  [KNET  ] pmtud: Global data MTU changed to: 1397Code language: CSS (css)
7. Troubleshooting: a host that shows up, then disappears
The failure mode that fooled me for a while isn’t “no logs.” It’s intermittent logs. A host appears in Loki, looks healthy, then goes quiet for stretches. The tell is in rsyslog’s own log lines, which rsyslog helpfully ships to Loki before it gives up:
{job="syslog", app="rsyslogd"} |= "omfwd"Code language: JavaScript (javascript)If you see pairs like this, the forwarder is flapping. This is sample output from Grafana, not a query:
# Sample output from Grafana: do not paste this into the query box
omfwd: [wrkr 0/...] no working target servers in pool available, suspending action
action 'action-1-builtin:omfwd' suspended (module 'builtin:omfwd'), retry 0.
action 'action-1-builtin:omfwd' resumed (module 'builtin:omfwd')Code language: PHP (php)
omfwd suspends the whole action when the TCP connection to Alloy drops, and anything generated during a suspension window is gone. The queue.size="10000" in the config only buffers so much before it starts discarding.
Scroll up one line from the suspend and rsyslog usually names the cause:
# Sample output from Grafana: do not paste this into the query box
omfwd: [wrkr 0/...] remote server closed connection.  Server is 10.0.5.10:514.
This can be caused by the remote server or an interim system like a load balancer or firewall.Code language: CSS (css)
A quick way to tell whether the fault is the node or the collector: compare suspend timestamps across hosts. On my cluster, pmox2 and pmox3 suspended within 3 to 213 ms of each other, repeatedly, over a 13-minute window. Two independent machines don’t coincidentally lose a TCP session in the same millisecond, so that rules out per-node firewall rules and per-node rsyslog problems and points squarely at the collector end. In my case Alloy was cycling its syslog receiver. If instead a single host suspends while its neighbours keep streaming, the problem genuinely is on that node.
Either way the fix is the same: make rsyslog stubborn about reconnecting.
action(type="omfwd"
       target="10.0.5.10"
       port="514"
       protocol="tcp"
       template="RSYSLOG_SyslogProtocol23Format"
       queue.type="LinkedList"
       queue.size="10000"
       queue.saveOnShutdown="on"
       action.resumeRetryCount="-1"
       action.resumeInterval="10")Code language: JavaScript (javascript)
action.resumeRetryCount="-1" tells rsyslog to retry forever instead of eventually dropping the action, and queue.saveOnShutdown="on" persists whatever is queued across an rsyslog restart so a reboot doesn’t cost you the buffer.
Verify the Full Stack
With all three pieces running, here’s a quick verification checklist in Grafana:
OTLP metrics (Grafana Explore → Prometheus):
count by (node) (proxmox_node_uptime_seconds)You should get exactly one series per node: pmox1, pmox2 and pmox3. Counting metric names tells you the feed is alive; counting nodes tells you every node is alive, which is the failure you actually care about. For the full metric surface, swap in count by (__name__) ({__name__=~".*proxmox.*"}). If you query a raw selector directly, keep the regex inside plain double quotes.
pve-exporter metrics (Grafana Explore → Prometheus):
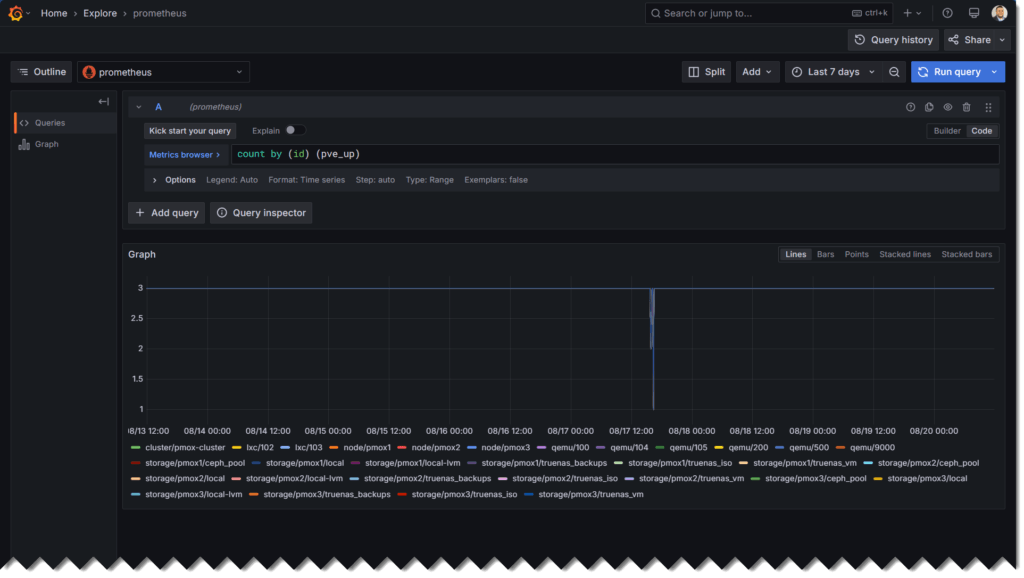
count by (id) (pve_up)You should see cluster, node, VM/LXC, and storage rows labeled with id values like node/pmox1, qemu/100, lxc/102, and storage/pmox1/local.
Logs (Grafana Explore → Loki):
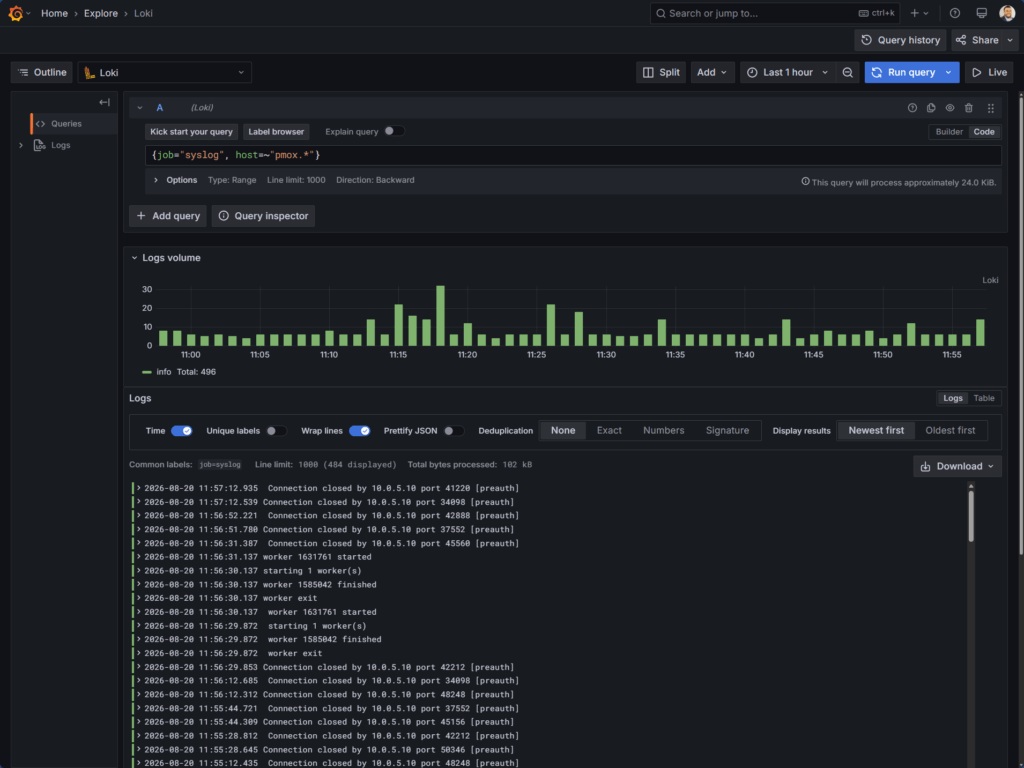
{job="syslog", host=~"pmox.*"}Code language: JavaScript (javascript)You should see Proxmox host log streams for pmox1, pmox2, and pmox3. If the query returns nothing for the current time range, send a fresh test log from one node with logger and retry over the last 15 minutes.
Add a Dashboard
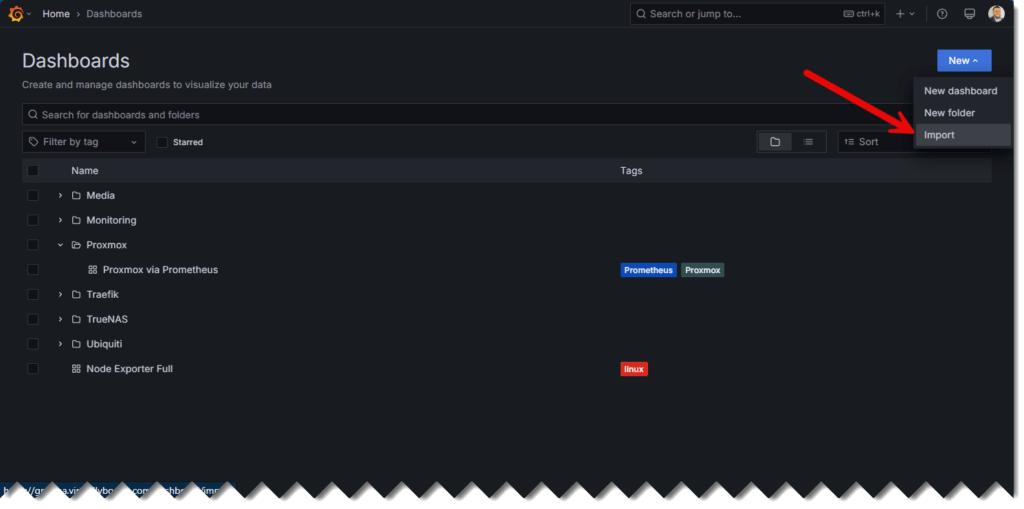
This is where it starts getting fun! You do not have to build a fancy dashboard from scratch, you can import one! For example, here is Grafana dashboard 10347, “Proxmox via Prometheus”, maintained by mittelab.
In Grafana: Dashboards → New → Import, enter 10347, then pick your Prometheus datasource.
You get 14 panels immediately: per-node CPU and memory history plus current gauges, per-guest CPU and memory, storage usage and space allocation, disk and network IO, and a resource-allocation summary table. It uses an instance template variable, so one dashboard covers every node in the cluster.
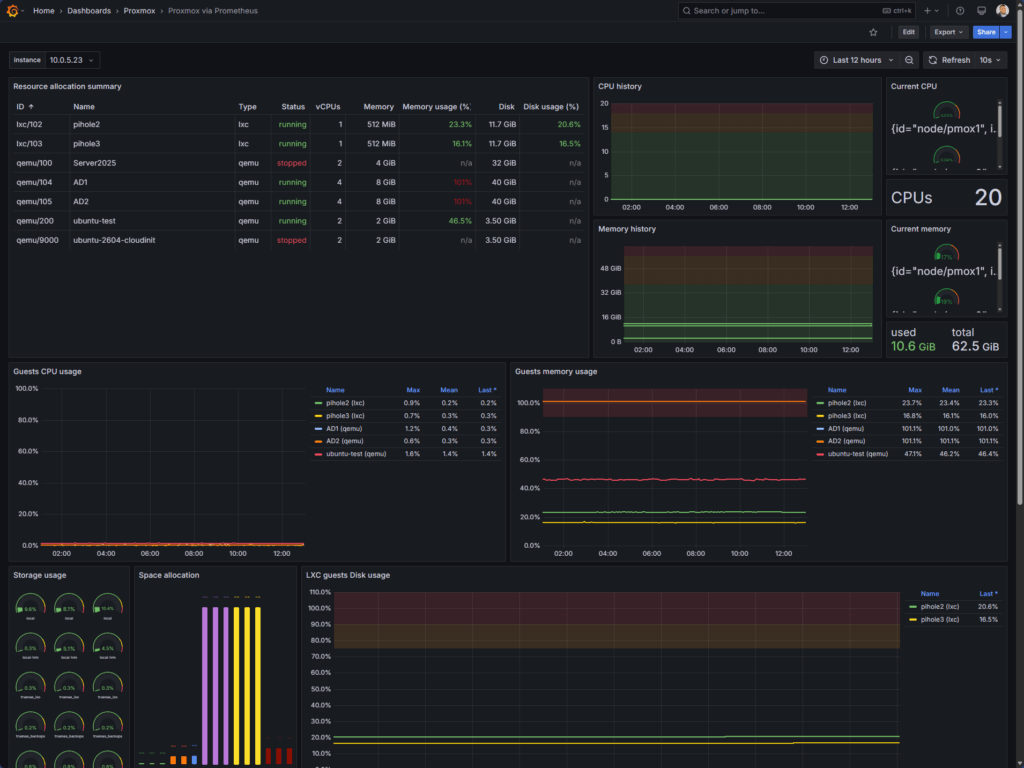
But note its scope. Every panel on 10347 queries pve_* metrics, which means it covers exactly one of the three swim lanes: the management plane. Nothing in it touches the OTLP feed or Loki. Treat it as an excellent starting point rather than the finished product.
Two easy extensions once it is imported:
- Add OTLP panels. Guest metrics arrive pre-labelled with
name,vmid,typeandnode, so a panel built onproxmox_vm_cpu_percentneeds no joins and no relabelling to produce a readable legend. Just remember the unit trap:proxmox_node_cpustat_cpu_percentis a 0 to 1 ratio, so multiply by 100 or set the panel unit to percent (0.0-1.0). - Add a logs panel. A Logs panel pointed at Loki with
{job="syslog", host=~"pmox.*"}sitting underneath the metrics turns “CPU spiked at 03:14” into “CPU spiked at 03:14 because an OSD went down.” That correlation is the entire reason for wiring up all three lanes.
Wrapping Up
Metrics tell you that something changed: a node’s memory climbed, a guest started thrashing disk. Logs tell you why: corosync lost quorum, an OSD flapped, a backup job failed. The management plane tells you what state things are supposed to be in: which guest is locked, which storage is nearly full, which node the cluster still believes is online. Any one of those on its own leaves you guessing at 2am. Together they close the loop.
Two things cost me more time than everything else combined, and both are worth repeating. Proxmox’s OTLP exporter infers unit suffixes from metric names and gets the cpustat family wrong. Trust the byte-valued metrics, and verify anything else against the Proxmox UI before you build a dashboard on it. And rsyslog fails quietly: when omfwd suspends, messages are dropped rather than queued, and the only evidence is rsyslog’s own log lines. Set action.resumeRetryCount="-1" from day one rather than discovering the gap weeks later.
The monitoring backlog is finally done, and with Proxmox pushing its own telemetry, I’ll know the moment something gets interesting! Hope this was helpful and fun!