
Proxmox 9 Observability: OpenTelemetry, Metrics, and Logs

Proxmox Observability in my home lab

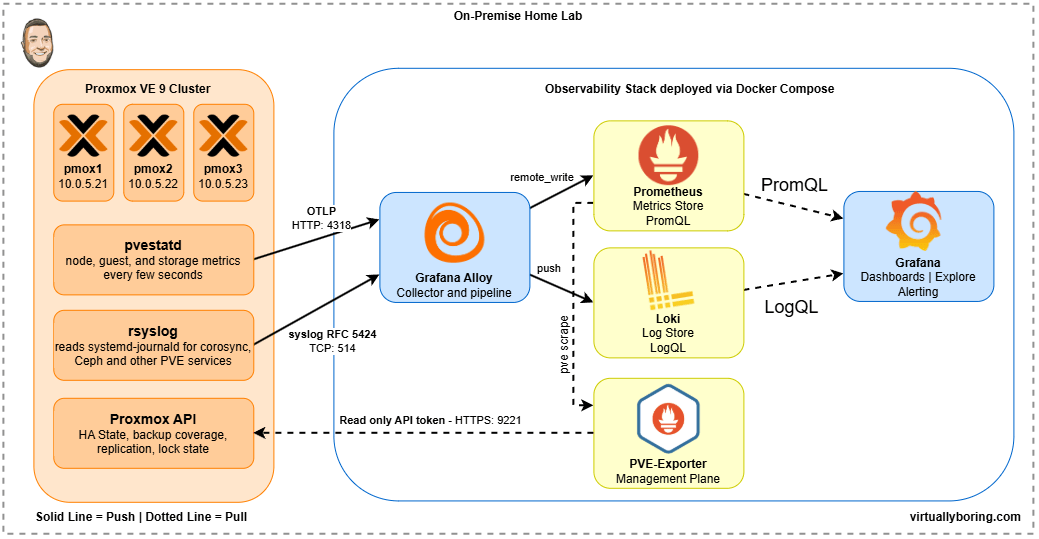
Set up proper monitoring” sat on my homelab backlog longer than I’d like to admit. What finally made me want to work it was another project I actually want to build, which turned out to need real observability underneath it first. So I went looking into how to do that properly on Proxmox, and found that upgrading from 8 to 9 had already handed me the best part of it. As of VE 9, the pvestatd daemon pushes its own metrics straight out to any OpenTelemetry Protocol (OTLP) endpoint, every few seconds, without anything installed on the nodes to make it happen.

So that covers performance: how the nodes, guests, and storage are doing right now. It does not tell you which guests have no backup job, whether replication is healthy, or what state the cluster thinks a VM is in, because that data lives in the Proxmox API rather than in system stats. And it stays silent when corosync loses quorum or a Ceph OSD starts flapping, because those are log events and OTLP metrics are not logs.

Proxmox observability needs three data streams, and no single product covers all three. Performance metrics arrive on Proxmox’s native OTLP push. The management plane, meaning HA state, backup coverage, and replication health, has to be read out of the Proxmox API by pve-exporter. Logs leave each node through rsyslog and land in Alloy. That’s why this post has three parts. Everything ends up in a self-hosted Grafana stack.

My Observability Stack

First I had to decide on an observability stack. There are a ton of options ranged from cloud-hosted SaaS (Datadog, Grafana Cloud, New Relic) to fully self-hosted. I wanted to go fully self-hosted which made me immediately think of running the entire Grafana observability, so that is what I did!

Here is what I deployed using Docker Compose:

  • Grafana is the visualization and dashboarding layer: dashboards, Explore, and alerting. Grafana itself stores nothing. It reads from Prometheus and Loki.
  • Prometheus is the metrics backend. It stores time-series metric data, provides a query language (PromQL) for it, and receives metrics via remote_write from Alloy.
  • Loki is the log aggregation backend. It stores logs indexed by labels (like host="pmox1" or job="syslog") and makes them queryable with LogQL. Loki is intentionally lightweight: it indexes labels, not full log content.
  • Grafana Alloy is the collection and pipeline layer. Alloy runs on TrueNAS as a container and acts as the central hub: it receives syslog from Proxmox nodes, receives OTLP metrics from Proxmox, scrapes exporters, and forwards everything to the right backend. Think of it as the plumbing between your infrastructure and your storage.

All of this runs on-prem. No data leaves the homelab, no subscription required, and the entire stack is open source.
Read more…

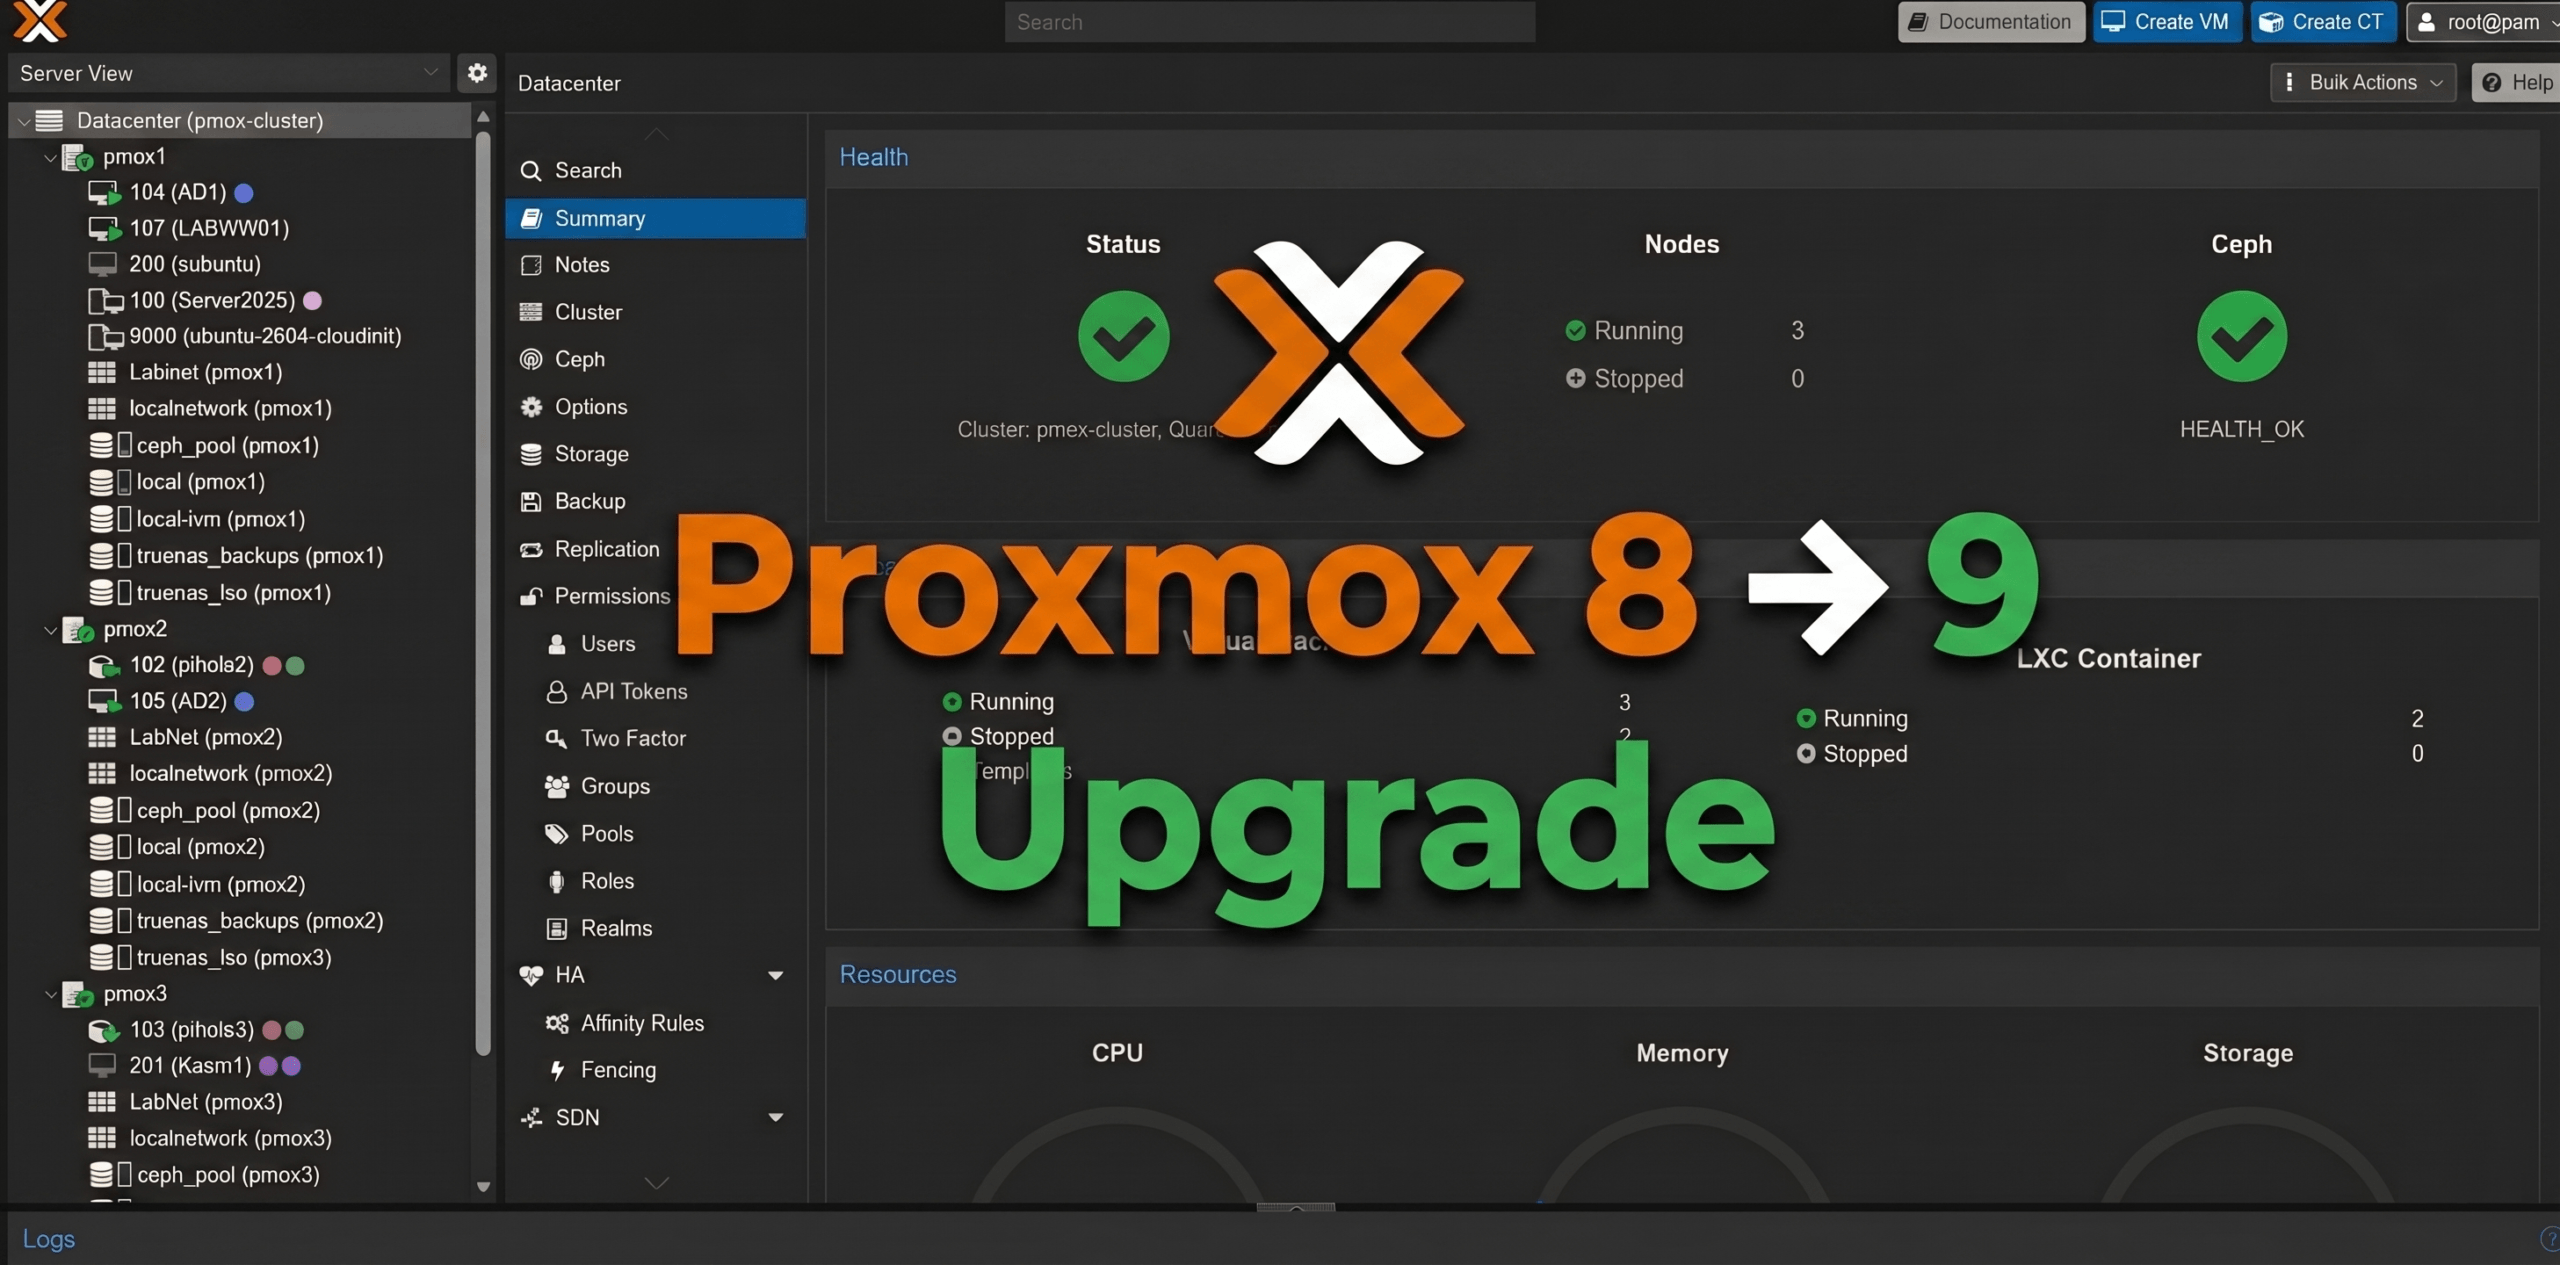
Upgrading Proxmox VE 8 to 9: A Real-World Walkthrough

I’ll be honest — I’ve been putting this off for a while.

Proxmox VE 9 dropped earlier this year, and every time I looked at the upgrade guide I thought “yeah, I’ll get to that.” This weekend I finally ran out of excuses and carved out some time to tackle it. Three nodes, a hyper-converged Ceph cluster, and a handful of HA-managed VMs. Nothing exotic, but enough moving parts to make it interesting.

This post is meant to complement the official Proxmox upgrade documentation — not replace it. If you want the authoritative source, go there. What I’m documenting here is what the upgrade actually looked like in practice on a real homelab cluster, including the things pve8to9 flagged and how I resolved them.

Read more…

Building an Ubuntu 26.04 LTS Cloud-Init Template in Proxmox

Ubuntu 26.04 LTS dropped last month, and instead of doing what I’d normally do — build a template, snapshot it, and slowly watch it age — I decided it was finally time to actually dig into Cloud-Init.

If you’ve built Proxmox templates before, you know the drill: create a VM, install the OS, install your packages, sysprep it, convert it to a template, and then clone it every time you need a new box. It works, but every clone inherits whatever state the template was in the day you built it. Packages drift. You’re manually cleaning up machine IDs and SSH host keys after every clone. Spin up ten VMs for a lab build and you’ve got ten rounds of post-boot cleanup ahead of you.

Cloud-Init sidesteps all of that. Instead of a fat, opinionated image, you start with a minimal cloud image — the same kind AWS, Azure, and GCP use under the hood. The image carries no fixed identity. When you clone it and boot it, Proxmox injects your config (username, SSH key, hostname, network settings) via a virtual CD-ROM drive, and Cloud-Init configures the VM from the inside on first boot. Clean machine ID, unique SSH host keys, fully configured — before you even open a terminal.

The real unlock is that your config is a YAML file. Want ten identical VMs? Same file, ten times. Want to add a package or a user? Edit the file. Your infrastructure becomes something you can version, reuse, and actually reason about — instead of a template you’re scared to touch because you don’t remember what’s in it.

That’s why I built this. Here’s exactly how I did it on Proxmox VE 9.2.3 with Ubuntu 26.04 LTS “Resolute Raccoon.” Still on Proxmox 8? I’d get the cluster current first — here’s how I upgraded my Proxmox cluster from version 8 to 9.

What is Cloud-Init, Actually?

Cloud-Init is an industry-standard first-boot initialization system — the same one AWS, Azure, and GCP use under the hood. Instead of manually clicking through an Ubuntu installer and then scrubbing machine IDs and SSH host keys from the image, you start with a pre-built minimal “cloud image” designed to be generic and stateless.

When you clone it and boot it, Cloud-Init reads a small config — hostname, username, SSH key, network settings — that Proxmox injects via a virtual CD-ROM drive. The VM configures itself automatically in seconds. No manual post-boot setup, no configuration drift, no forgotten hostname changes causing weird network issues two weeks later.

One important thing to understand upfront: Cloud-Init only runs once — on first boot. It’s not a service that re-applies config every time the VM starts. After that first boot, it stamps a flag on the VM and never runs again. Rebooting a running VM doesn’t pull fresh packages or re-apply settings. If you want a fresh, fully updated machine, the workflow is to clone the template again — not reboot an existing one. That distinction shapes everything about how you operate day-to-day with Cloud-Init.

Read more…